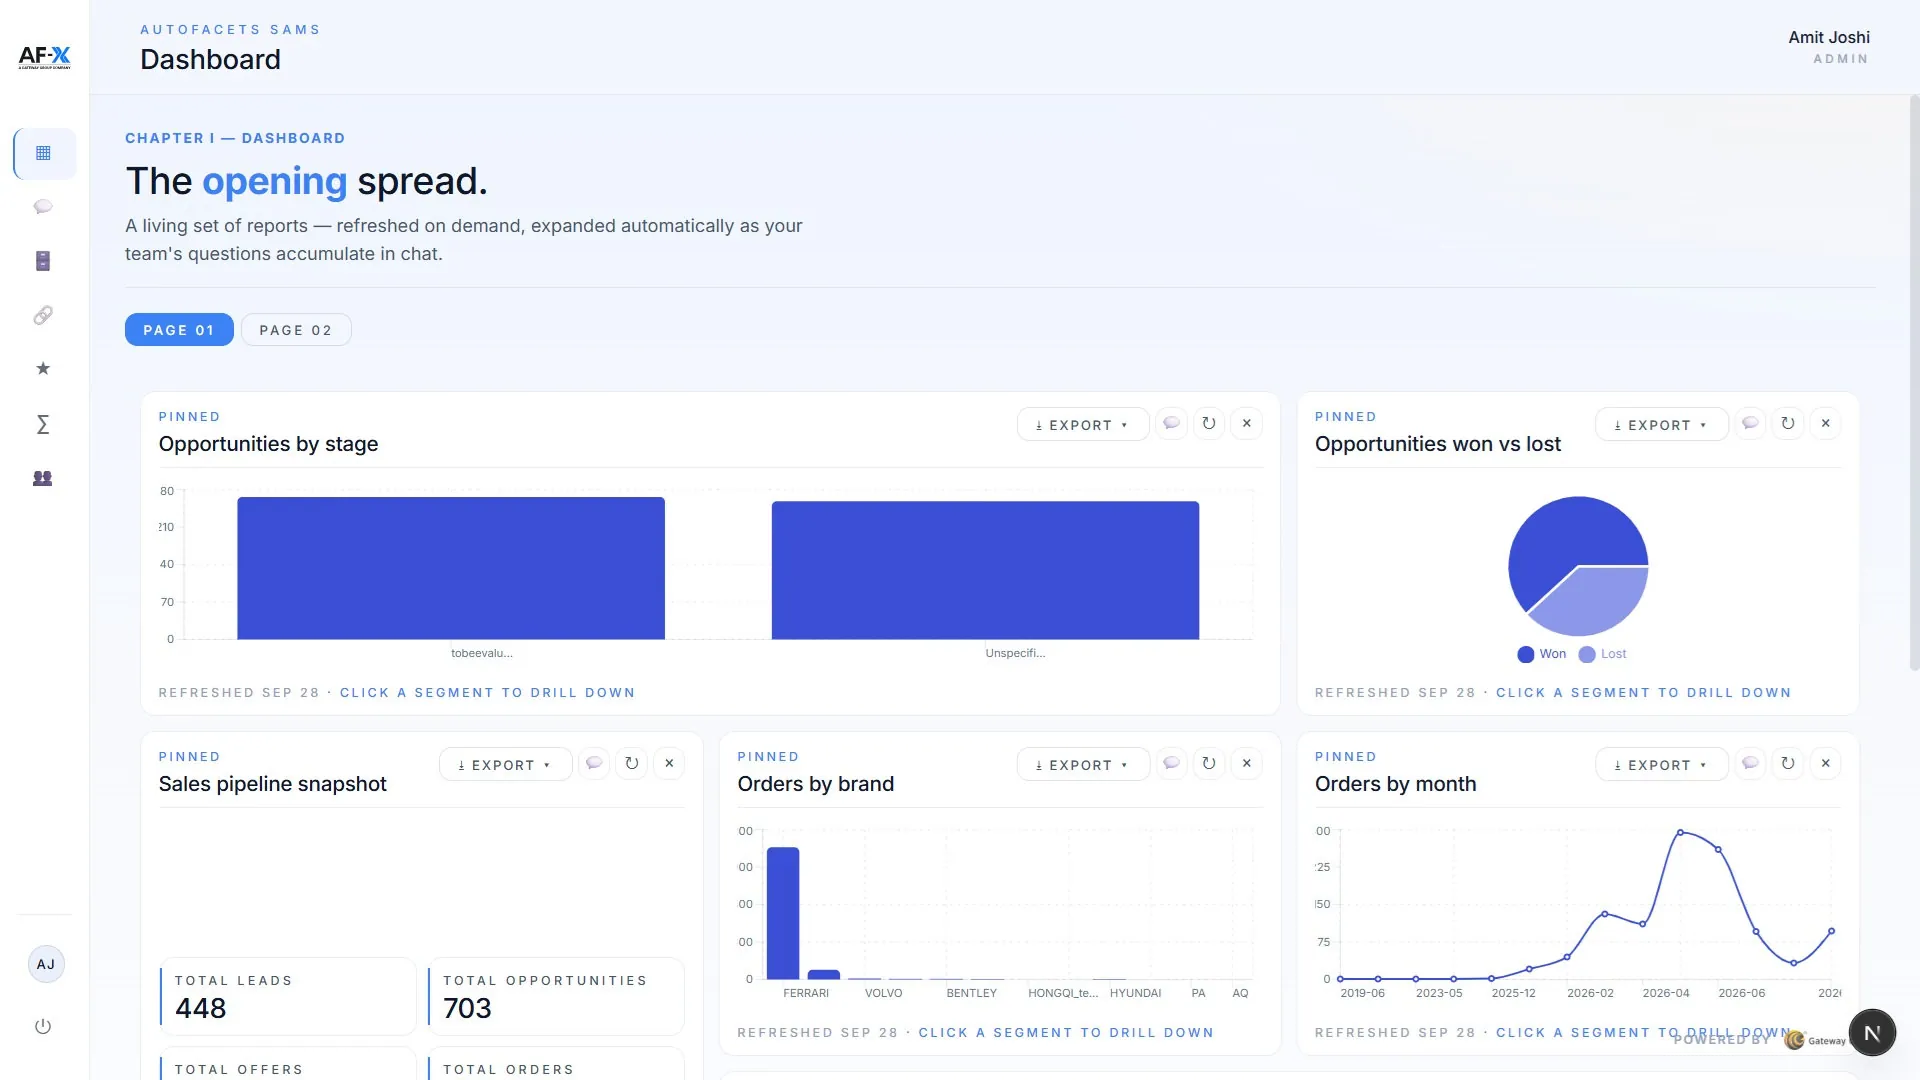
Getting one number means raising a report request
Every new question goes back to whoever writes the reports.
Questions stop being asked

By business
By size
By platform
Find your fit
Tell us what you run and how big it is, and we will show you the platform, the products and the pricing tier that match.
→ Who We ServeThe ecosystem triangle
AF-X is the only platform family present on all three sides.
→ See the triangleData X
One clean record of every vehicle, customer, part and site — held in the region you chose.Intelligence X
The numbers the business runs on, live, with the same definition on every site.AI X
AI inside the product at the point the decision is made — rank, predict, price, draft, answer.Your data. Your workflow. Automotive AI that does the job, not the demo.
→ How AF-X uses your data→ What AI native meansWhere do you want to start?
The claim
The only automotive platform family that runs dealer retail, independent workshops, fleet & mobility, parts distribution and remarketing — on one platform, with one data model.
Ask your group’s data a question in your own words, and get a chart, a table and an explanation back.
Smart Dashboard exists to move one number: Unlock Your Data. One vehicle and customer record across every system you run. Every AF-X product names the outcome it is there to move before it lists anything it does, and reports against that number once it is live.
Three problems, in the words the buyer uses.
Every new question goes back to whoever writes the reports.
Questions stop being asked
Reports are built once and rarely re-cut.
People export to spreadsheets instead
No single place holds the figures side by side.
Cross-cutting questions go unanswered
Let anyone ask a question in plain English, get an answer they can read, and keep the ones worth watching on a dashboard that stays live.
“Built for questions you can ask in your own words.”
Ask it once. Keep it if it is worth watching.
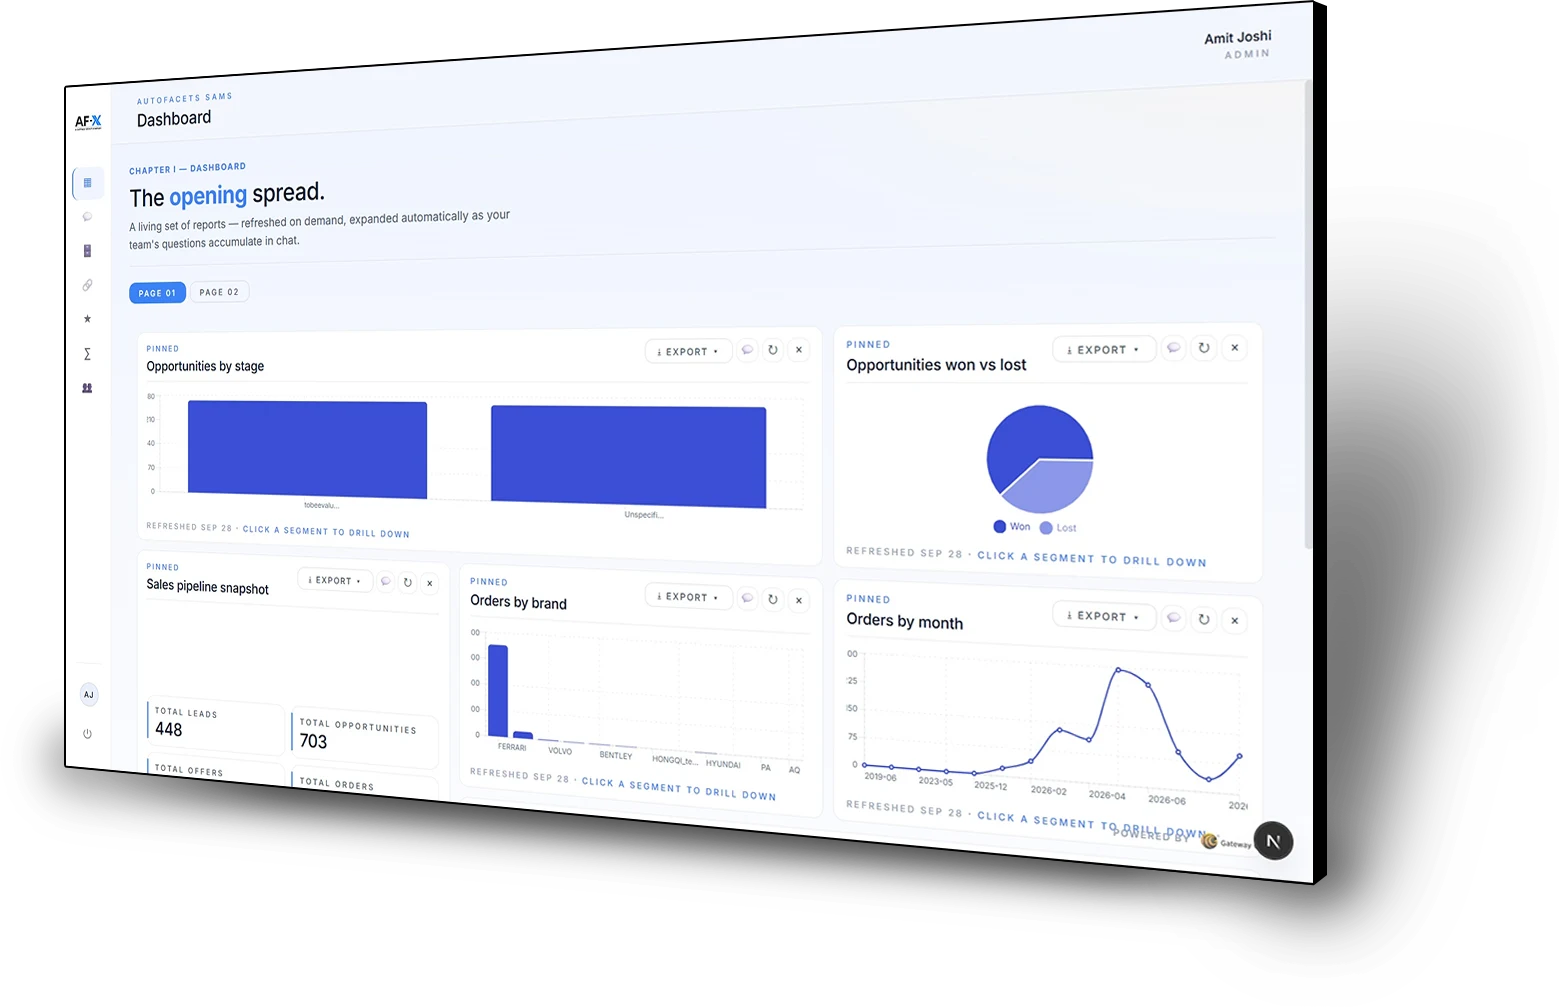
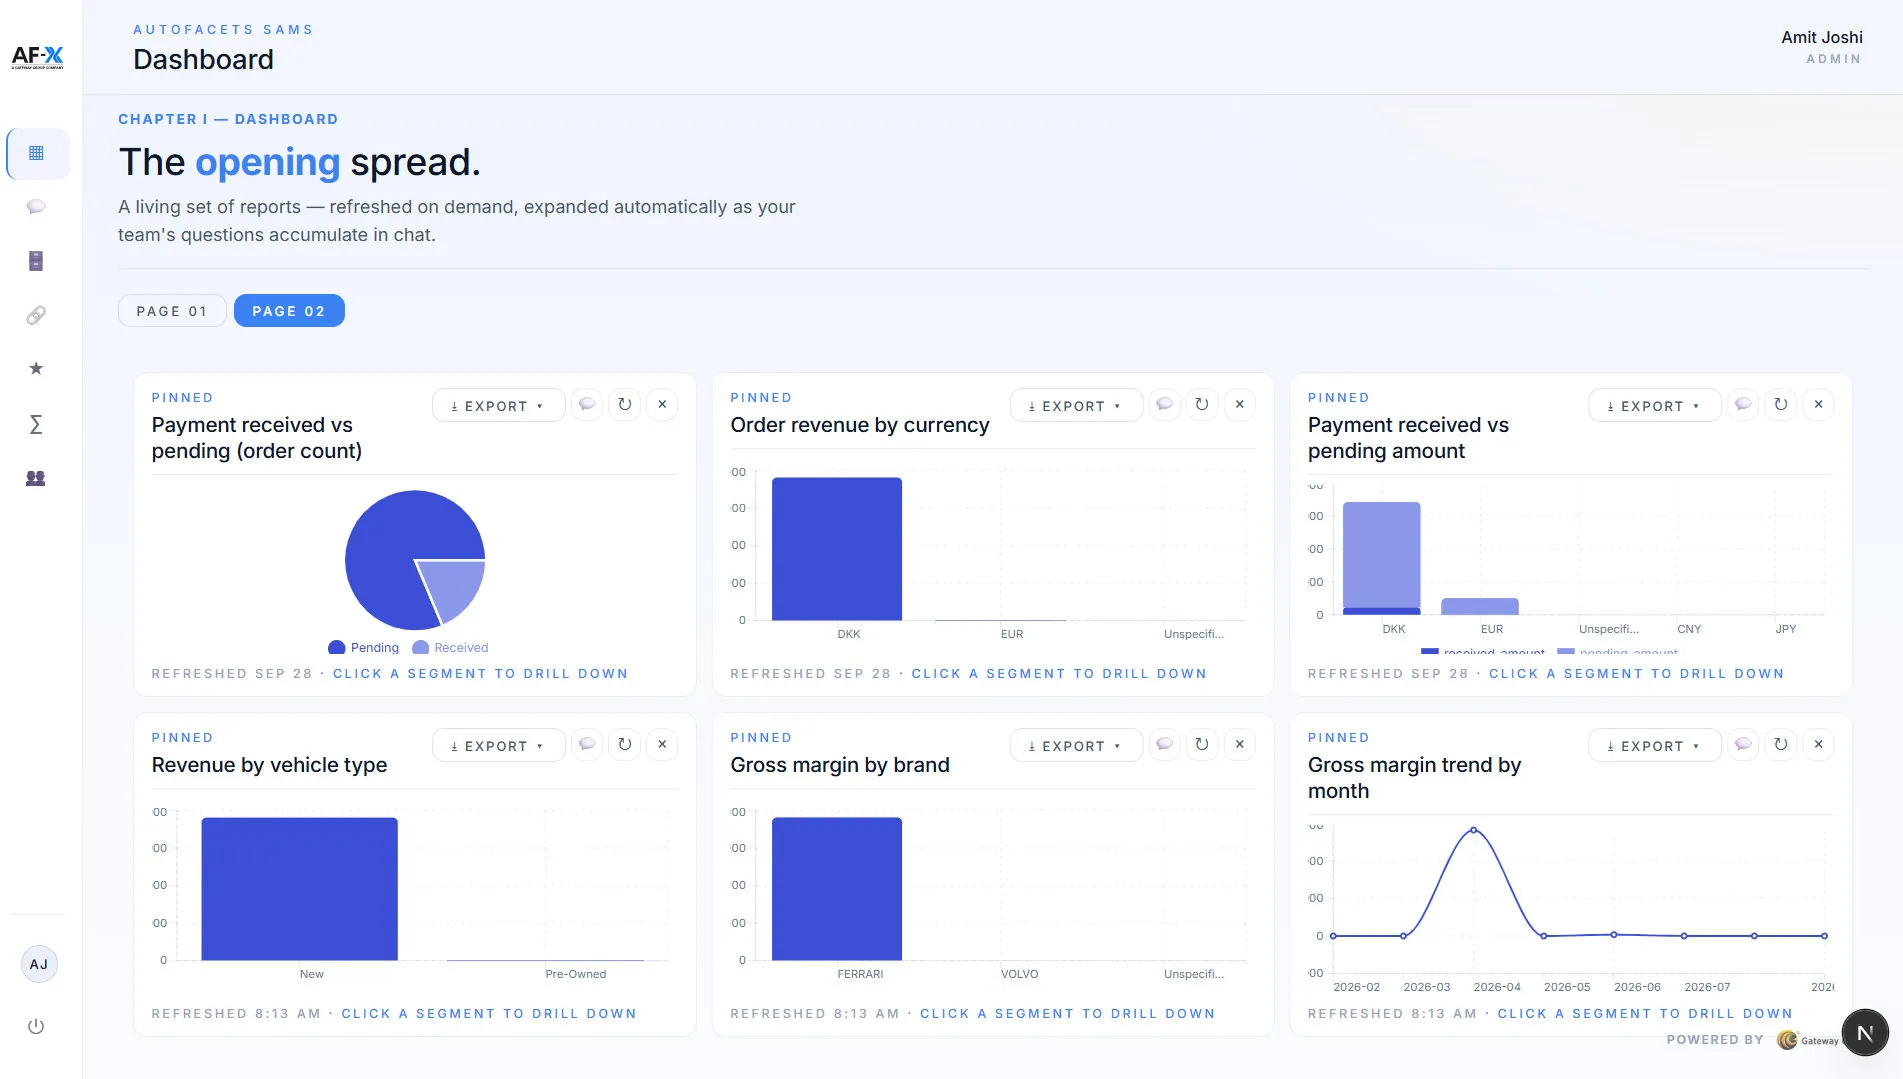
Someone asks a question in plain English. Smart Dashboard turns it into a query against the sources you have made active and returns a chart or table with a short written summary beside it. Follow-up questions narrow or re-cut the same answer without starting again, and any answer worth watching can be pinned to a dashboard, where it re-queries the source each time the page loads.
Keep your core systems in charge.
Connects read-only to the systems your group already runs, or takes a spreadsheet export, and answers against whichever sources you make active. Each group’s data sits in its own isolated schema.
Smart Dashboard reads from: